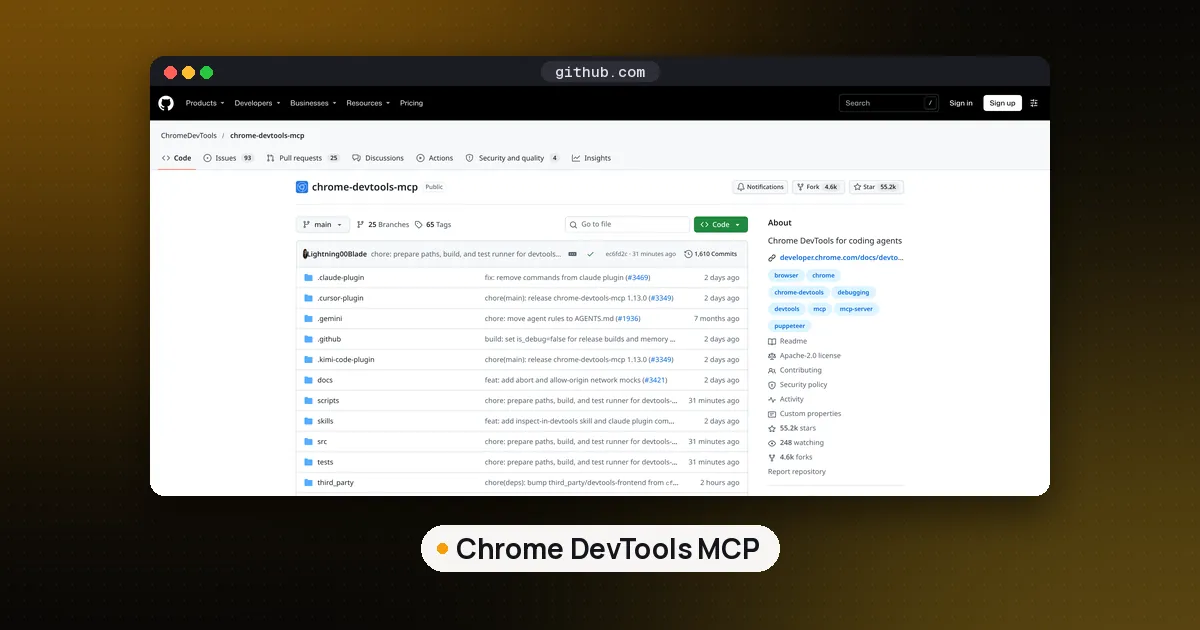
Chrome DevTools MCP is Google's official MCP server that lets a coding agent open, drive and inspect a real Chrome browser. To set it up, add npx -y chrome-devtools-mcp@latest as an MCP server in your client (one command in Claude Code, Codex or Gemini CLI), then ask the agent to check a page. Version 1.13.0, released November 11, 2026, adds logpoints and network mocks, which make it the strongest choice when your agent needs to debug a web app rather than just click through it.
The project's repository, ChromeDevTools/chrome-devtools-mcp, is on GitHub's daily trending list on November 13 with more than 55,000 stars, and Google now suggests "chrome devtools mcp claude code", "codex", "install" and "vs playwright mcp" as you type. This guide covers setup per client, which tools you get, what changed in 1.13, the flags that keep it safe, and how it compares with Playwright MCP. We tested it on our own machine first; the box above says exactly what we ran.
What Chrome DevTools MCP does
The package chrome-devtools-mcp is an MCP server and a command line tool from the Chrome DevTools team, licensed Apache 2.0. Under the hood it uses Puppeteer to control Chrome and the real DevTools frontend to analyze what happens in the page. The official README lists three jobs: recording performance traces and turning them into insights, browser debugging (network requests, screenshots, console messages with source mapped stack traces), and reliable automation that waits for each action to finish.
That middle job is the difference. Most browser tools for agents are built to complete a task on a website. This one is built to answer "why is my page broken or slow", which is what a coding agent needs after it edits frontend code.
Officially it supports Google Chrome and Chrome for Testing only. It needs a current Node.js LTS, npm, and Chrome stable or newer.
How to set up Chrome DevTools MCP in your client
Every client uses the same command underneath. The generic MCP config from the README is:
{
  "mcpServers": {
    "chrome-devtools": {
      "command": "npx",
      "args": ["-y", "chrome-devtools-mcp@latest"]
    }
  }
}
The project's client configuration guide gives the short versions:
| Client | Setup |
|---|---|
| Claude Code | claude mcp add chrome-devtools --scope user npx chrome-devtools-mcp@latest, or the plugin (MCP plus skills) |
| Codex | codex mcp add chrome-devtools -- npx chrome-devtools-mcp@latest |
| Gemini CLI | gemini mcp add chrome-devtools npx chrome-devtools-mcp@latest, or the extension with skills |
| Cursor | One click install link in the guide, or paste the JSON above into your MCP settings |
| VS Code Copilot | Chat: Install Plugin From Source, then ChromeDevTools/chrome-devtools-mcp |
| OpenCode | Add an mcp entry to opencode.json |
For Claude Code, the plugin route is worth it. Run /plugin marketplace add ChromeDevTools/chrome-devtools-mcp, then /plugin install chrome-devtools-mcp@chrome-devtools-plugins, and restart. You get the server plus seven skills: general debugging, the CLI, accessibility audits, cookie and session debugging, Largest Contentful Paint fixes, memory leak hunting, and connection troubleshooting. Remove any older manual install first, as the guide notes. If skills are new to you, our agent skills guide explains how agents load them.
For Codex on Windows 11, the guide adds an env block and startup_timeout_ms = 20_000 in .codex/config.toml because Chrome can take a while to start. If you use MCP for the first time, see how to run an MCP server locally.
To check it works, ask your agent: "Check the performance of https://developers.chrome.com". The server only launches Chrome when the first browser tool runs, so connecting alone opens nothing.
Which tools you get, and how much context they cost
With default settings, version 1.13.0 gave our test client 33 tools whose definitions add up to about 31,500 characters of JSON. That is the text your agent's context pays for before it does anything. They fall into groups: input (click, fill, fill_form, drag, hover, type_text, press_key, upload_file, handle_dialog), navigation and pages, emulation and resize, performance traces, network requests, and debugging (evaluate_script, console messages, CSS styles, Lighthouse audit, screenshots, accessibility snapshots, screencasts and logpoints). The full list lives in the tool reference.
Optional groups stay off until you ask for them. When we turned on network mocks, memory debugging and extensions together, the list grew to 53 tools and about 51,700 characters. Going the other way, --slim cuts it to three tools (navigate, evaluate, screenshot) at about 1,000 characters, which is plenty for "open this page and tell me what it says".
One detail that tripped up our script: page ID routing is on by default, so every page tool requires a pageId. Agents read it from list_pages, but if you script the server yourself, call that first. Use --no-page-id-routing if your client shares one server across sessions and you want the old behavior, or --isolated so each session gets a throwaway Chrome profile.
What's new in 1.13: logpoints and network mocks
The 1.13.0 release adds three features, and we tried two of them.
Logpoints (set_logpoints) let the agent print a value at a line of code without editing the file. You pass entries such as src/cart.ts:42 'total:', cart.total, and the output shows up in the console messages. Our test page had a checkout button whose price request failed. We set a logpoint on the fetch line, filled the email field, and clicked Pay. The console list then held, in order, our logpoint line ("pay clicked, email = a@b.co"), the 404 for the price API, and the page's own "checkout failed" error. That is the kind of trace a developer builds by hand with console.log edits. One catch: a line with no executable code is rejected with a clear error, so point at a statement, not a function header.
Network mocks (mock_network, behind --categoryNetworkMocks) answer a request with a local file or a different upstream URL, scoped to one page. We mocked the failing price endpoint with a small JSON file. The tool replied that the mock applies after a reload; after reloading and clicking again, the page showed "Total: 19.99", the request list reported a 200, and the mock reported one hit. The tool also warns that mocks disable the HTTP cache, so do not compare performance numbers taken with and without them.
The third feature lets a mock forward to another live URL instead of a file. The release also fixes a bug where logpoints still worked with JavaScript evaluation turned off; in our run, --no-javascript-evaluation dropped both evaluate_script and set_logpoints, leaving 31 tools.
Privacy and safety flags to set first
Read these before pointing an agent at a browser that holds your accounts.
- Usage statistics are on by default. Google collects tool success rates, latency and environment details. Add
--no-usage-statistics, or setCHROME_DEVTOOLS_MCP_NO_USAGE_STATISTICS. SettingCIalso disables it. - Performance tools may send trace URLs to the CrUX API for field data. Add
--no-performance-cruxfor internal sites. - The profile persists. By default it reuses
~/.cache/chrome-devtools-mcp/chrome-profile, so logins stick between runs. Use--isolatedfor a clean temporary profile. - Limit where it can go.
--allowedUrlPattern(Chrome 149 or newer) and--blockedUrlPatternrestrict navigations and requests. - File access is narrow by default. If your client does not offer MCP roots, tools that read or write files are limited to the system temp folder. That is why our mock body lived in
/tmp. - Do not let the agent edit its own config. The configuration docs warn that an agent able to write the config file can change flags such as the Chrome path and URL rules.
To work with your normal signed in browser, Chrome 144 and newer support --autoConnect: enable remote debugging at chrome://inspect/#remote-debugging, and Chrome asks you to allow the connection. The advanced usage guide also covers --browser-url for a Chrome started with a debugging port, which suits sandboxes. Any program on your machine can use an open debugging port, so close it when you are done.
Chrome DevTools MCP vs Playwright MCP
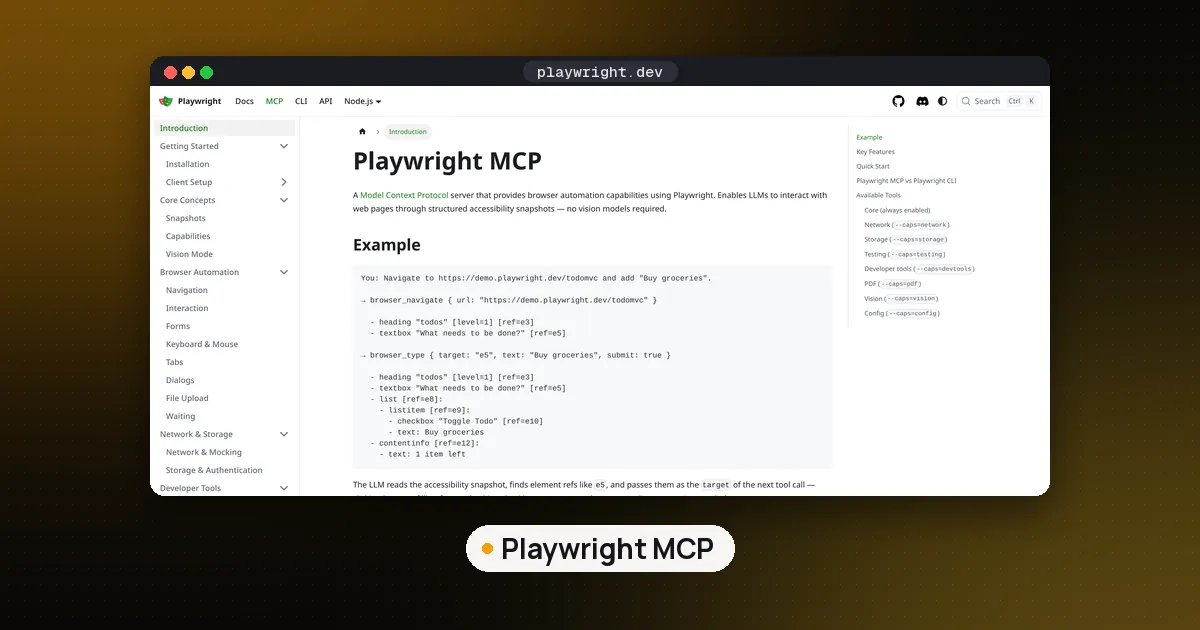
Playwright MCP 0.0.85 gave the same test client 25 tools and about 21,200 characters of definitions, so it is lighter by default. Both read pages through accessibility snapshots with element IDs, both fill forms and click, and both list console messages and network requests.
| Item | Chrome DevTools MCP 1.13.0 | Playwright MCP 0.0.85 |
|---|---|---|
| Default tools (our count) | 33 | 25 |
| Browsers | Chrome and Chrome for Testing | Chromium, Firefox, WebKit |
| Performance traces and Lighthouse | Yes | No |
| Logpoints and network mocks | Yes (1.13) | No |
| Heap snapshots | Yes, more with --memoryDebugging | No |
| Trim or extend tools | --slim for 3 tools, category flags | --caps adds vision, pdf, devtools |
Pick Chrome DevTools MCP when the agent is fixing your own web app and needs traces, logpoints, mocks or memory data. Pick Playwright MCP when you need Firefox or WebKit or want plain automation with a smaller tool list. If your agent has a shell, a CLI with a skill usually costs even less context; our agent browser vs Playwright comparison measured that, and Chrome DevTools MCP ships its own chrome-devtools CLI for the same reason. For full browser agent frameworks, see Browser Use vs Stagehand vs Playwright MCP.
FAQ
Is Chrome DevTools MCP free?
Yes. The server and CLI are open source under Apache 2.0 and install from npm at no cost. You still pay for whatever model your agent uses, and the tool definitions take up part of its context on every turn.
How do I use Chrome DevTools MCP in Claude Code?
Run claude mcp add chrome-devtools --scope user npx chrome-devtools-mcp@latest, or install the plugin from the project's marketplace to get the skills too. Restart Claude Code, then ask it to check a page's performance or console errors.
Does Chrome DevTools MCP work headless?
Yes. Add --headless to the args. Version 1.13 also suggests that flag in its error message when Chrome cannot find a display, which is common on servers and in containers.
Can it use my logged in Chrome profile?
Yes, with --autoConnect on Chrome 144 or newer after you enable remote debugging, and Chrome asks you to approve the connection. The agent can then see every open window in that profile, so only do this with a client you trust.
Should I pin a version instead of using @latest?
The README recommends @latest so you get fixes. If a team shares one config, pinning (for example chrome-devtools-mcp@1.13.0) keeps behavior stable, but update the skills whenever you change versions, because they describe tools of a specific release.